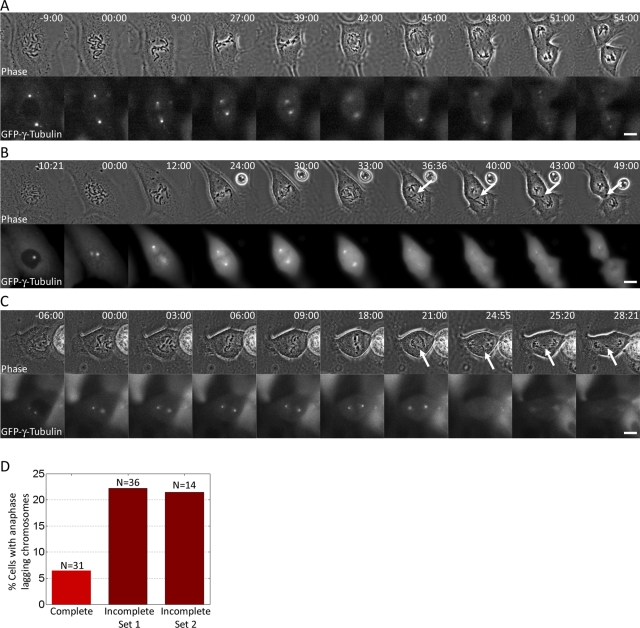
FIGURE 2:
Incomplete spindle pole separation at NEB is associated with elevated frequencies of anaphase lagging chromosomes. (A–C) Still images from time-lapse movies of PtK1 cells expressing GFP–γ-tubulin. Phase-contrast images are shown in the top row and single focal plane GFP images are shown in the bottom row. A cell in which the spindle poles were fully separated at NEB is shown in A. In the cell shown in B, the centrosomes were separated along the z-axis of the cell prior to NEB (−10:21-min time point; only one centrosome is in focus in the image) but moved toward the center of the nuclear space and in very close proximity upon NEB (00:00-min time point). The same cell exhibits an anaphase lagging chromosome (arrow). In the cell shown in C, the centrosomes were shifted to one side of the nuclear space prior to and upon NEB. One lagging chromosome (arrow) was present in anaphase. (D) Frequencies of anaphase lagging chromosomes in cells with complete and incomplete spindle pole separation at NEB. The Incomplete Set 2 data refer to an additional set of cells with incomplete centrosome separation imaged by four-dimensional (three-dimensional plus time) time-lapse microscopy (see Materials and Methods for details). Scale bars, 10 μm.

