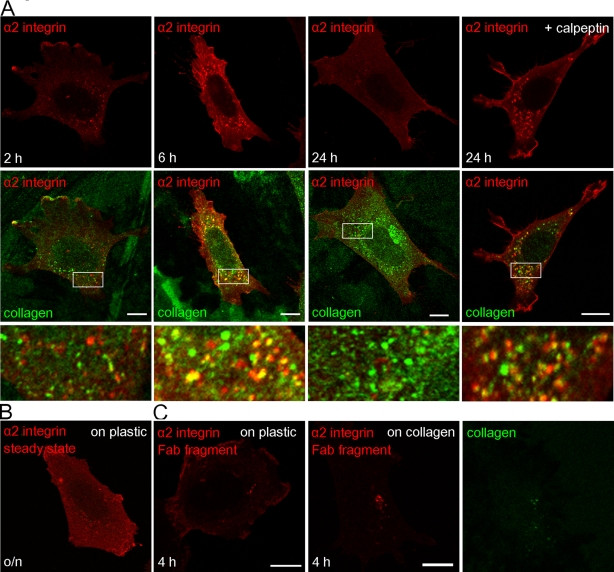
FIGURE 10:
α2β1integrin distribution in cells plated on collagen. (A) Steady-state distribution of integrin (red) and collagen type I (green) after 2, 6, and 24 h with or without calpeptin. Merged images of integrin and collagen are below, with details shown in blow-up images. (B) Control integrin labeling of cells cultivated on plastic. Images in A and B were scanned with similar confocal intensity settings for easier comparison. (C) Surface labeling of α2β1 integrin by A211E10 antibody, followed by monovalent goat anti–mouse Fab549 DyLight (red) on cells cultivated on plastic (left) or on collagen coating (right) for 2 h. After surface labeling, cells were further incubated for 2 h, fixed, and labeled for collagen (green). Bars, 10 μm.

