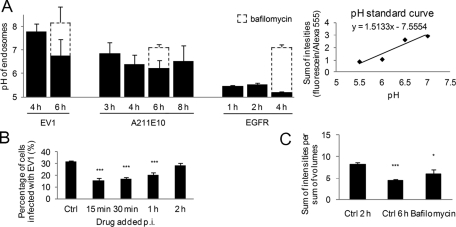
FIGURE 5:
Significant acidification is not required for α2 integrin degradation and EV1 infection. (A) pH of α2-MVBs after α2 integrin clustering with EV1, A211E10, and EGFR ± bafilomycin was measured from live SAOS-α2β1 cell images as described in Materials and Methods. The ratio between goat anti–rabbit/mouse FITC and goat anti–rabbit/mouse Alexa 555 signal, bound at 1:1 stoichiometric ratio to anti-EV1 antibody on the plasma membrane before internalization, was measured from each time point and compared with the pH standard curve. The pH standard curve was acquired by measuring ratios of virus-bound dyes in the presence of different pH buffer solutions supplemented with nigericin (20 µM). The results were analyzed from 15 to 30 confocal sections, and the experiments were repeated two (EV1) to four (α2 integrin) times (±SE). (B) Effect of 50 nM bafilomycin on EV1 infection rate was determined. The drug was added 15 min, 30 min, 1 h, or 2 h p.i. Infection was calculated from >750 cells from three individual experiments (±SE). Statistical significance was tested with Student's t test (***p < 0.001). (C) The effect of bafilomycin (50 nM) on α2 integrin fluorescence intensities was measured between 2 and 6 h of internalization. Quantification was done from confocal sections of 30 microscope images containing at least 20 cells each from three independent experiments (±SE). Statistical significance was tested with Student's t test (*p < 0.05, ***p < 0.001).

