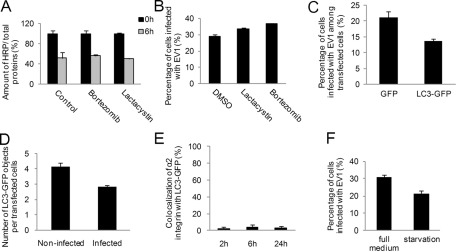
FIGURE 6:
Connection of α2β1 integrin pathway to proteasomal and autophagosomal degradation. Effect of proteasome inhibitors lactacystin (10 μM) and bortezomib (0.7 μM), on (A) the activity of α2 integrin–conjugated HRP and (B) EV1 infection. For EV1 infectivity, calculations of >750 cells from three independent experiments were analyzed. Results are shown as mean values (±SE). C) Infection rate in SAOS-α2β1 cells transfected with GFP (control) or LC3-GFP was counted from at least 750 cells and three independent experiments. Results are shown as averages (±SE). (D) The amount of LC3-GFP structures per cell at 3 h p.i. was calculated in noninfected (control) and infected cells. Altogether 200 cells were calculated from three independent experiments, and results are shown as mean values (±SE). (E) Quantification of colocalization between clustered and internalized α2 integrin and the transfected autophagosomal marker LC3-GFP was performed. Quantification was done from single confocal sections with the colocalization tool in the BioImageXD software. Calculations were done from 30 cells from three independent experiments (±SE). (F) Infectivity of EV1 was tested after overnight serum-free starvation or during full medium conditions. A minimum of 750 cells was counted from three independent tests. Results are presented as average of three experiments (±SE).

