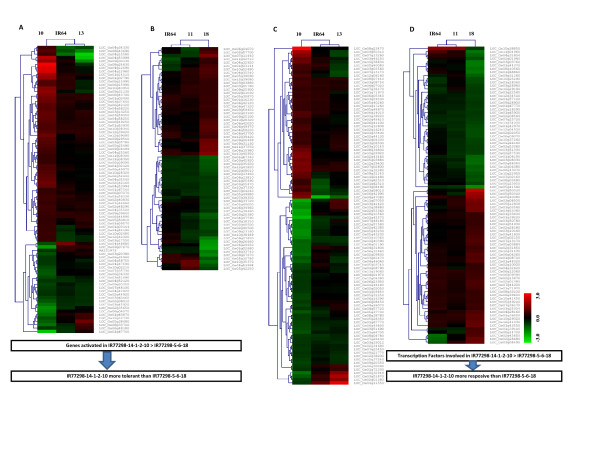
Figure 3.
General view of genes specifically expressed in two tolerant lines compared to their susceptible counterparts under severe drought stress condition. In this figure: (A) indicates transcripts specifically expressed in IR77298-14-1-2-B-10, and (B) indicates transcripts specifically expressed in IR77298-5-6-B-18, from seven functional categories including cell growth, hormone biosynthesis, cellular transports, amino acid metabolism, reactive oxygen species (ROS), signaling and stress-regulated genes and carbohydrate metabolism. (C) and (D) indicate transcripts related to transcription factor families which are specifically expressed in two tolerant lines compared to their susceptible counterparts. Gene identifiers correspond to the each transcript are from MSU version 6.1 of Rice Oligoarray from Rice Genome Annotation Project (RGAP) 6.1 (http://rice.plantbiology.msu.edu/). A fold change ≥ 1.5 is shown in red (up-regulated), a fold change ≤ -1.5 is shown in green (down-regulated), and no change in black (FDR<0.05).

