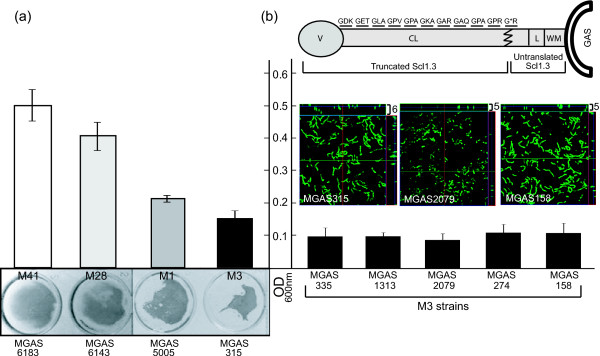
Figure 1.
Variation in biofilm formation among GAS strains. (a) Wild type M41-, M28-, M3-, and M1-type GAS strains were grown 24 h under static conditions and analyzed spectrophotometrically following crystal violet staining (top). Visual representation of corresponding wells is shown below. (b) Schematic representation (not to scale) of Scl1.3 protein of M3-type GAS. Translated GXY repeats within the collagen-like (CL) region are shown with an asterisk representing the location of the premature stop codon resulting in a truncated protein. V, variable region; L, linker region; WM, wall-membrane associated region. Below, spectrophotometric measurements of 24-h biofilms following crystal violet staining are graphed for M3-type GAS strains. Absorbance values (OD600) are averages of at least three experiments done in triplicate wells. Corresponding confocal analyses of 24-h biofilms of MGAS315, MGAS2079, and MGAS158 are shown. Images are X-Y orthogonal Z-stack views and average vertical thickness is indicated in micrometers (top right).

