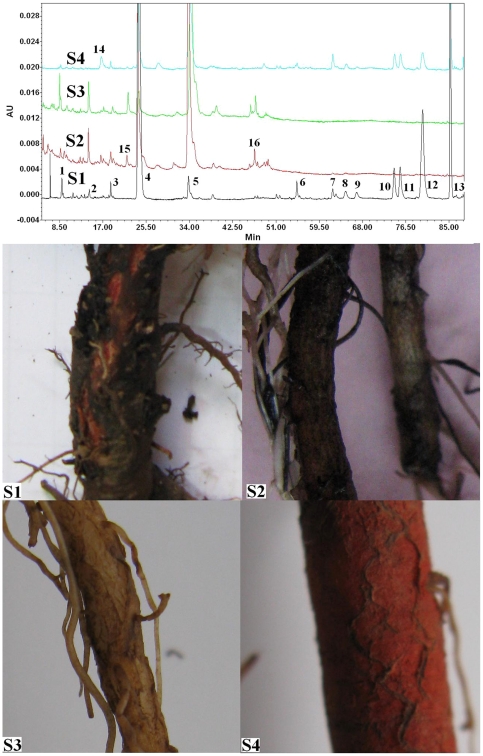
Figure 2. Metabolic profiles of the red roots of S. castanea Diels f. tomentosa Stib (S1), and the hydroponic (S2), white (S3) and red (S4) roots of S. miltiorrhiza by HPLC at 280 nm.
Peak 1, danshensu; peak 2, caffeic acid; peak 4, rosmarinic acid; peak 5, salvianolic acid B; peak 7, dihydrotanshinone I; peak 10, cryptotanshinone; peak 11, tanshinone I; peak 13 tanshinone IIA.

