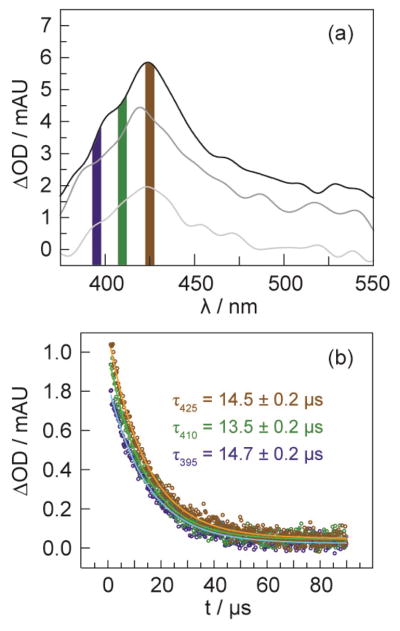
Figure 5.
(a) TA spectra and of [Re]–•F3Y–βC19 collected 500 ns (top), 5 μs (middle) and 30 μs (bottom) after a 7 ns 355 nm excitation pulse of laser light. (b) Lifetime decay of TA signal at 395 (
 ), 410 (
 ), and 425 (
 ) nm. The monoexponential fit is shown by the solid lines. The solution contained 50 μM [Re]–F3Y–βC19 with 20 equiv (1 mM) Ru(NH3)6Cl3, 1 mM CDP, and 3 mM ATP, 15 mM MgSO4 and 5% glycerol in 50 mM borate buffer (pH 8.3). Colored vertical bands (a) indicate the portion of the spectrum polled for recording the kinetic decays in (b).

