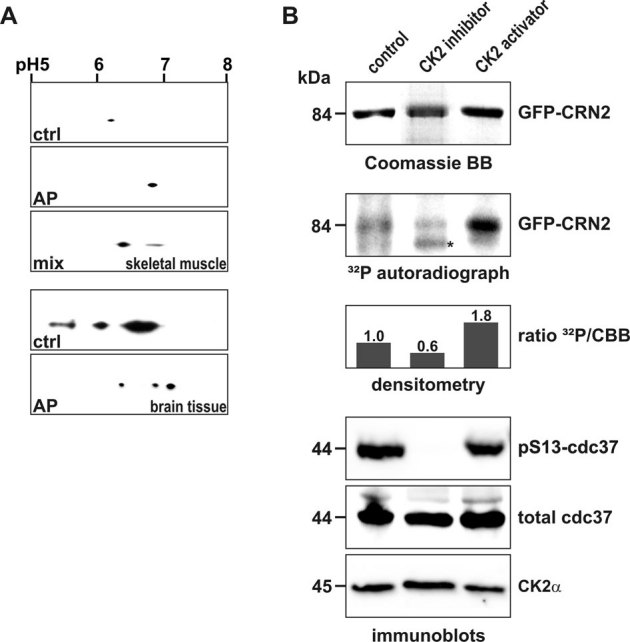
Figure 4. CK2 phosphorylates CRN2 in vivo.

(A) presence of a phosphorylated pool of endogenous CRN2. Lysates of murine skeletal muscle (upper three panels) and brain tissue (lower two panels) were separated by 2D-gel electrophoresis. CRN2 was visualized by western blotting using mAb K6-444. The first panel presents the untreated sample (ctrl), the second panel the in vitro de-phosphorylated sample (alkaline phosphatase, AP), and the third panel shows two CRN2 spots resulting from a mixture of the untreated and de-phosphorylated samples (muscle sample only). In contrast to brain tissue (forth and fifth panel), in skeletal muscle only a single spot of CRN2 is detected which corresponds to CRN2 isoform 35. (B) modulation of the in vivo CK2 activity changes the phosphorylation status of CRN2. 293TN cells over-expressing GFP-CRN2 were grown in the presence of the CK2 inhibitor TBB, the CK2 activator 1-ethyl-4,5-dicarbamoylimidazole or solvent control before addition of 32P-orthophosphate. Subsequently, cells were lysed, GFP-CRN2 was immunoprecipitated, samples were separated by SDS-PAGE, proteins were stained by Coomassie brilliant blue (first panel), and gels were dried and used for autoradiography (second panel). Densitometric analysis determined that the CK2 inhibitor decreased the level of CRN2 phosphorylation by 40%, while application of the activator led to an increase of 80% (third panel). Immunoblots for pS13-cdc37, a marker of the in vivo CK2 activity, total cdc37, and CK2α are given as controls (forth to sixth panel). One representative experiment is shown. First and second panel, for illustration purposes the order of lines from the original data was digitally re-arranged. Asterisk, unspecific autoradiography signal which does not correspond to the Coomassie stained CRN2 protein band.
