
Figure 5. Fg binding and neutrophil activation.
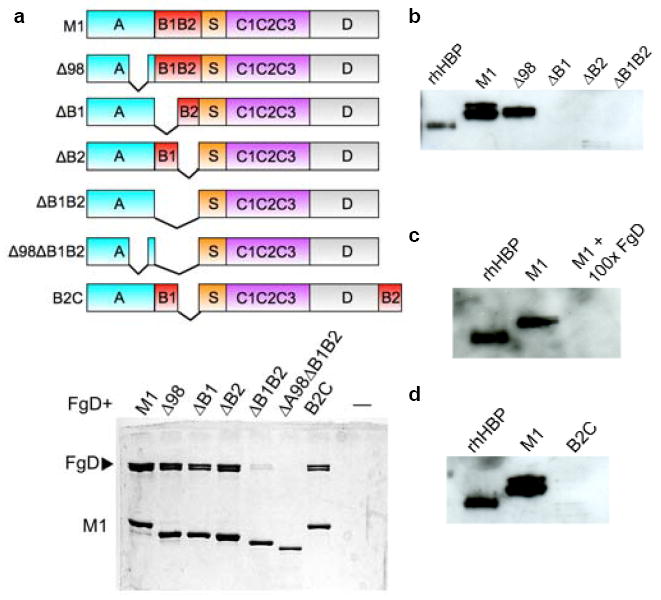
a, Schematic of M1 constructs (top), with domains denoted. Bottom, association of His-tagged M1, Δ98 (Δ98-125), ΔB1 (Δ133-161), ΔB2 (Δ162-189), ΔB1B2 (Δ133-189), Δ98ΔB1B2 (Δ98-125, Δ133-189), and B2C (residues 162-189 deleted and inserted after C-terminal residue 453) with FgD as assessed by a Ni2+-NTA agarose coprecipitation assay and visualized by non-reducing Coomassie-stained SDS-PAGE. Only bound fractions are shown. b, Release of HBP by human neutrophils incubated with M1, Δ98, ΔB1, ΔB2, or ΔB1B2, as assayed by an anti-HBP western blot. The leftmost lane contains recombinant HBP, rHBP, as a positive control. The difference between this and other HBP samples is due to glycosylation. c, Release of HBP inhibited by a 100-fold excess of FgD, and (d) elicited by B2C, both visualized as in panel b.