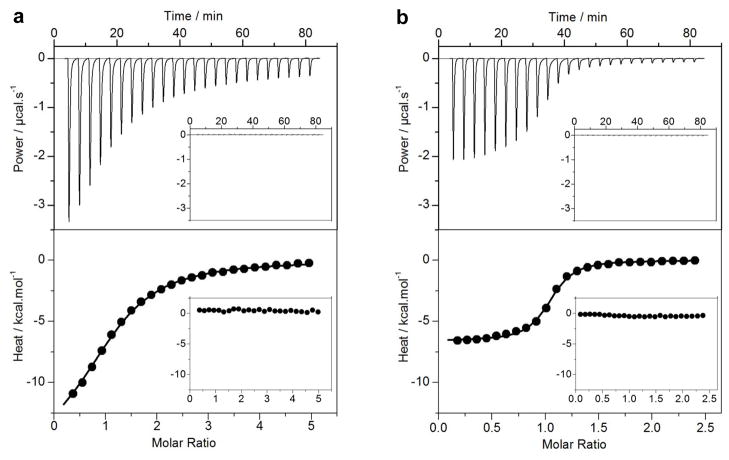
Figure 2.
ITC analysis for the binding of Bid_BH3 peptide to BclXL_FL (a) and BclXL_dTM (b) constructs. The upper panels show raw ITC data expressed as change in thermal power with respect to time over the period of titration. In the lower panels, change in molar heat is expressed as a function of molar ratio of Bid_BH3 peptide to the corresponding construct. The solid lines in the lower panels show the fit of data to a one-site model, as embodied in Eq [1], using the ORIGIN software. The insets show same titrations conducted in the presence of DMPC/DHPC bicelles.

