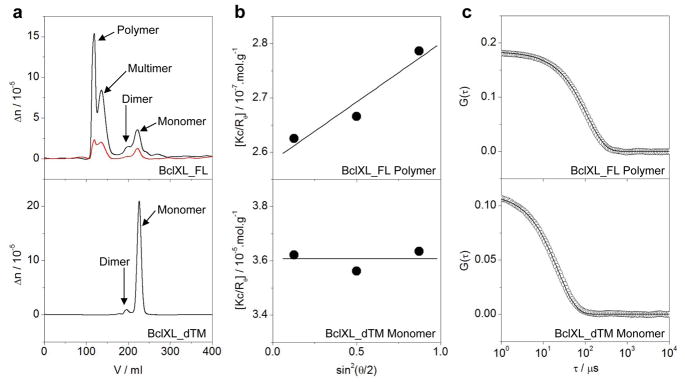
Figure 3.
ALS analysis for BclXL_dTM and BclXL_FL constructs as indicated. (a) Elution profiles as monitored by the differential refractive index (Δn) plotted as a function of elution volume (V) for BclXL_FL (top panel) and BclXL_dTM (bottom panel) constructs. Note that the elution profile for BclXL_FL construct is shown at both 50μM (black) and 10μM (red) initial protein concentrations loaded onto the Superdex-200 column, while that for BclXL_dTM construct is only shown at 50μM (black). (b) Partial Zimm plots obtained from analytical SLS measurements at a specific protein concentration for BclXL_FL polymer (top panel) and BclXL_dTM monomer (bottom panel). The solid lines through the data points represent linear fits. (c) Autocorrelation function plots obtained from analytical DLS measurements at a specific protein concentration for BclXL_FL polymer (top panel) and BclXL_dTM monomer (bottom panel). The solid lines through the data points represent non-linear least squares fits to Eq [11].

