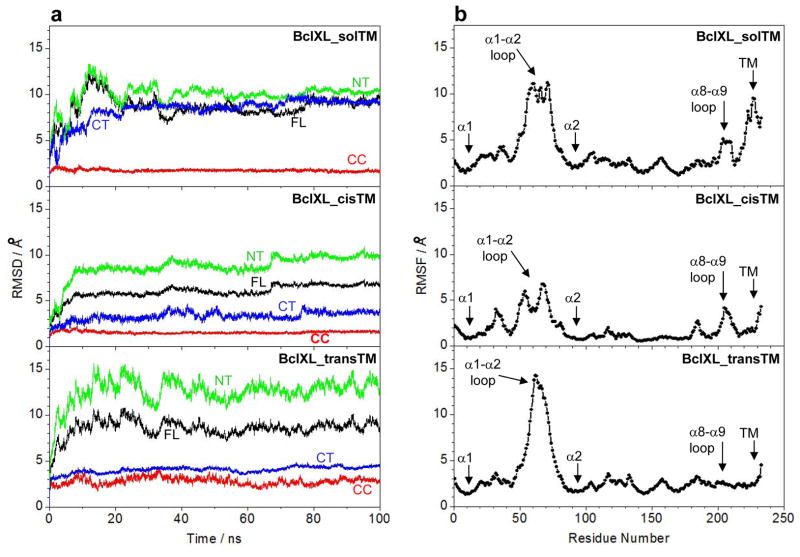
Figure 9.
MD analysis on structural models of full-length BclXL in three distinct conformations with respect to the C-terminal TM domain (α9 helix). (a) Root mean square deviation (RMSD) of backbone atoms (N, Cα and C) for residues 1–233 (black), residues 86–195 (red), residues 1–85 (green) and residues 196–233 (blue) within each simulated structure relative to the initial modeled structure of BclXL_solTM, BclXL_cisTM and BclXL_transTM as a function of simulation time. Note that, for each construct, the RMSD of full-length (FL) protein spanning residues 1–233 is also deconvoluted into the central core (CC) region spanning residues 86–195, the N-terminal (NT) region spanning residues 1–85, and the C-terminal (CT) region spanning residues 196–233. (b) Root mean square fluctuation (RMSF) of backbone atoms (N, Cα and C) averaged over the entire course of corresponding MD trajectory of BclXL_solTM, BclXL_cisTM and BclXL_transTM as a function of residue number.

