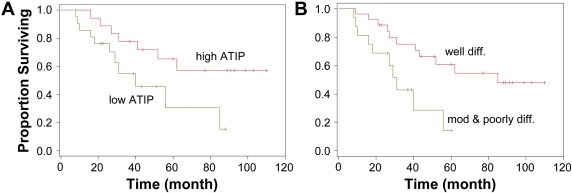
Figure 3.

The effects of MTUS1/ATIP expression on prognosis Kaplan–Meier plots of overall survival in patient groups defined by MTUS1/ATIP immunohistochemistry (A, High ATIP: higher than mean staining, Low ATIP: lower than mean staining) and differentiation (B). The differences in survival rates are statistically significant (p < 0.05).
