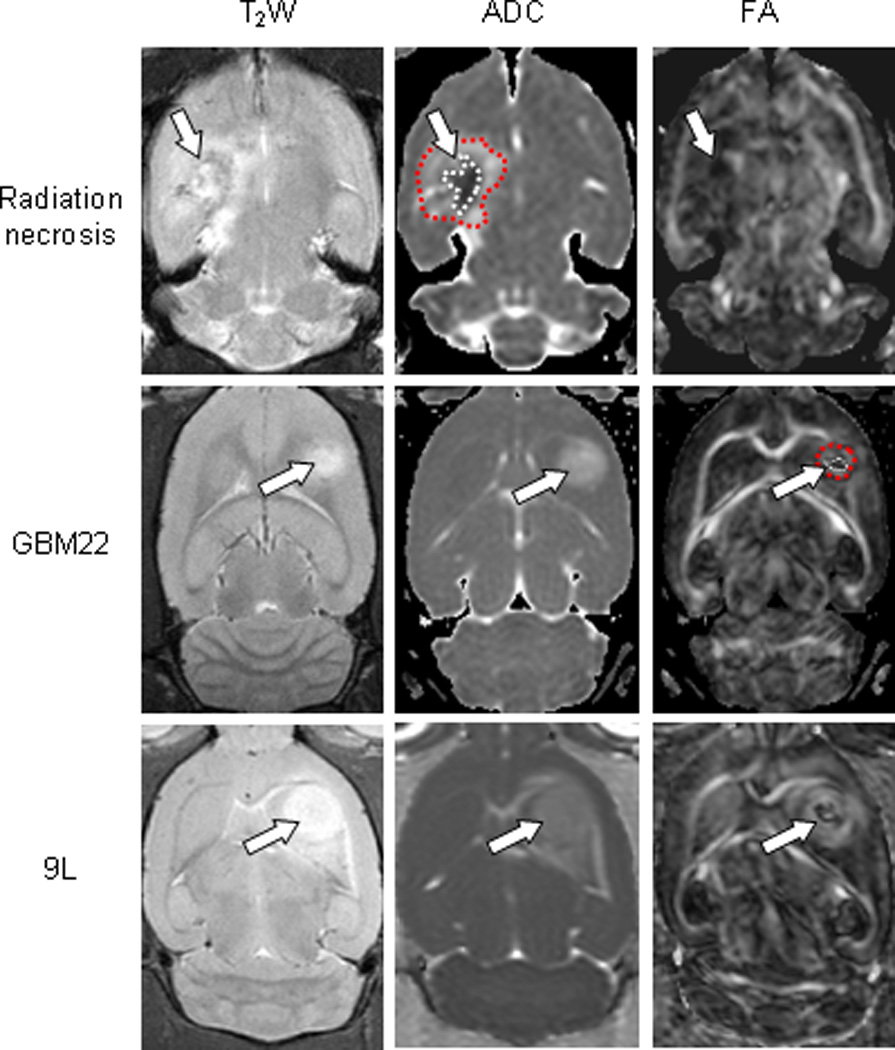
Fig. 3.

Comparison of the MRI features of radiation necrosis (26 weeks post-radiation), GBM22 (3 weeks post-implantation), and 9L gliosarcoma (9 days post-implantation). Radiation necrosis: On the ADC map, radiation necrosis is hypointense in the central zone and hyperintense in the peripheral zone. The lesion shows low diffusion anisotropy on the FA map. GBM22: The tumor is hyperintense on the ADC map. On the FA map, there is high diffusion anisotropy in the peripheral zone, with low diffusion anisotropy in the central zone. 9L gliosarcoma: The lesion is hyperintense on the ADC map. On FA map, it shows high contrasts and various degrees of high-level diffusion anisotropy within the tumor. Examples of ROIs, the central zone (1) and the peripheral zone (2), were drawn on ADC maps (for the radiation necrosis model), and on FA maps (for the GBM22 and 9L models). These ROIs were transferred to identical sites on other DTI index maps.
