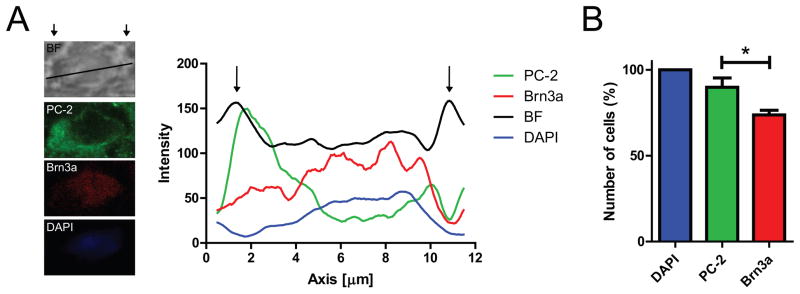
Figure 2. Subcellular analysis of polycystin-2 immunoreactivity in adult mouse RGCs.
A. Representative intensity analysis along a region of interest (ROI) line indicated in the bright field (BF) image. Intensity of immunoreactivity is plotted as 8 point moving average over distance (in μm). Arrows define the borders of the RGC as identified as peaks in BF intensity. Maximum intensity of polycystin-2 (PC-2) is in the cytoplasm, whereas Brn3a immunoreactivity co-localizes with the nuclear stain DAPI. B. A total of 89.8 ± 5.4% of cells in the RGC layer (defined based on positive DAPI staining) were positive for polycystin-2, whereas only 73.7 ± 2.8% of cells were positive for Brn3a (n=4, P<0.05). Quantification is based on analysis of maximum projection images of z-stacks (7–10 μm thickness) obtained from four different retinae.

