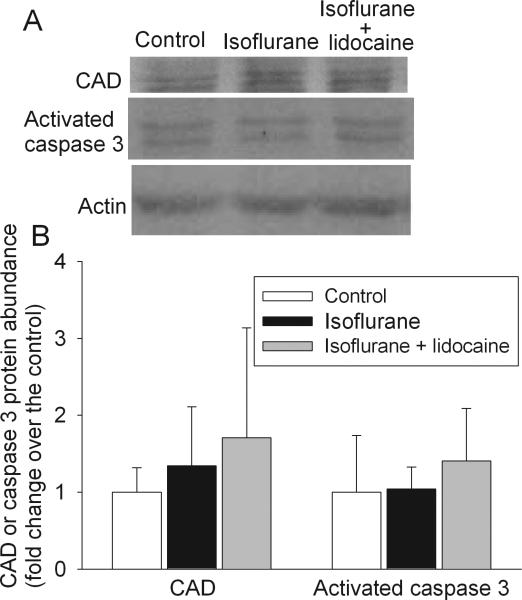
Fig. 5. Expression of caspase-activated DNase (CAD) and activated caspase 3 in rat brains.
Eighteen-month-old Fisher 344 rats were exposed to or not exposed to 1.2% isoflurane in the presence or absence of lidocaine for 2 h. The hippocampus was harvested at 29 days after the isoflurane exposure for Western analysis. A representative Western blot is shown in panel A and the graphic presentation of the CAD and activated caspase 3 protein abundance quantified by integrating the volume of autoradiograms from 4 to 5 animals is shown in panel B. Values in graphs are expressed as fold changes over the mean values of control animals and are presented as the means ± S.D.

