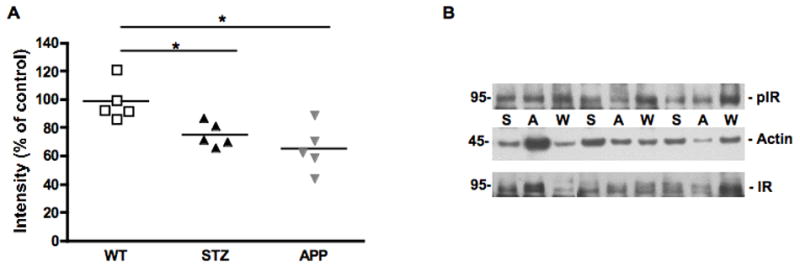
Figure 5.

Phosphorylation of insulin receptor in mouse sciatic nerve. Scatter plot representing the individual ratio of intensity of pIR/actin (A) in mouse sciatic nerve of 7-8 months old APP transgenic (APP) mice, or of age-matched mice after 12 weeks of diabetes (STZ) compared to aged-matched wild type mice (WT). N=5 mice per group, *p<0.05 vs WT by one-way ANOVA followed by Dunnett’s post hoc test. Representative western blot of phosphorylated insulin receptor and actin (B) in mouse sciatic nerve of 7-8 months old APP transgenic (A) mice, or of age-matched mice after 12 weeks of diabetes (S) compared to aged-matched wild type mice (W).
