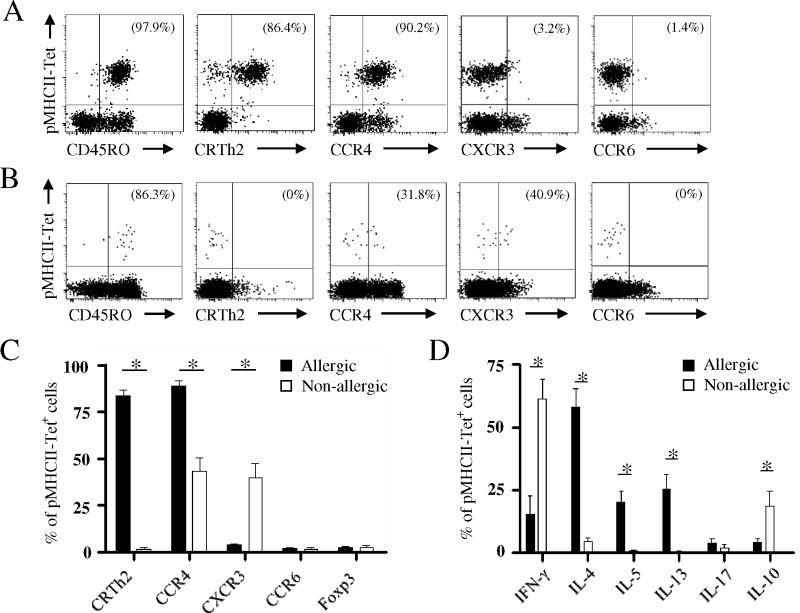
Figure 3.
Phenotype of Aln g 1-specific T cells. Representative flow cytometry plots showing ex vivo multicolor phenotyping of Aln g 1-specific CD4+ T cells in allergic (A) and non-allergic individuals (B). C, Ex vivo phenotype of Aln g 1-specific CD4+ T cells. D, Cytokine production by Aln g 1-specific CD4+ T cells. A and B, Percentages of tetramer-positive cells expressing the given marker are indicated in the upper right quadrant. C and D, Data are mean ± SEM from at least 6 individuals per group. Differences between groups were analyzed by Mann-Whitney U-test. * P < 0.001.

