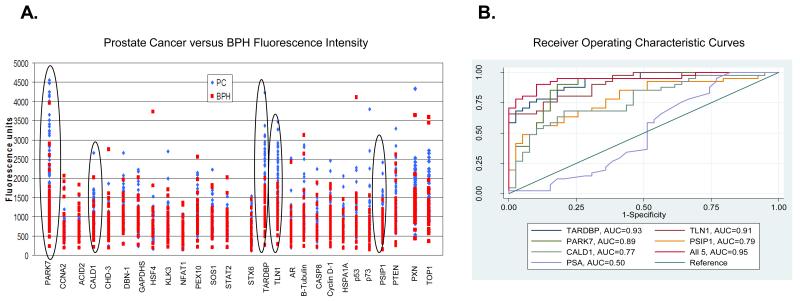
Figure 3.
(A): A scatter plot of the fluorescence intensity units is shown for all autoantibody reactivity. Fluorescence units for the BPH are shown in red, and the fluorescence units for the prostate cancer are shown in blue. The 5 circled signatures highlight the best separation of prostate cancer from BPH samples. (B): A receiver operating characteristic (ROC) curve was constructed for each of the immobilized antigens using individual fluorescence intensity values for each case and BPH control. The top 5 autoantibodies to the immobilized antigens are shown in the figure. Also included in the figure is the area under the curve (AUC) for each of the 5 antigens. ROC curve for serum PSA is also shown. The PSA values for our cases and BPH controls reflect the levels of the samples (ng/ml) at the time of collection. PSA has an AUC of 0.50 for our cohort.

