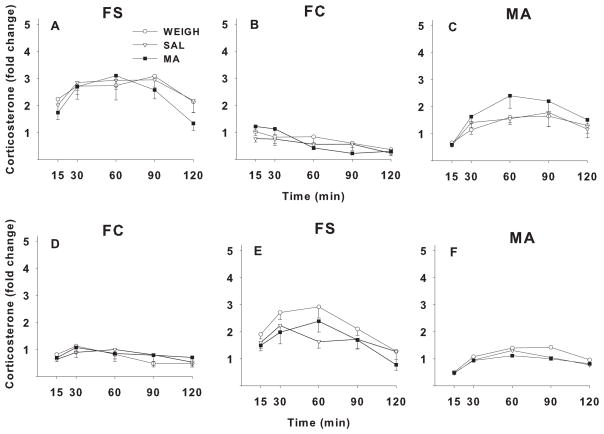
Figure 3.
Relative change in plasma CORT levels in adult rats following one of three stressors. Rats were treatment on P11–20 with MA, SAL, or were only weighed (WEIGH). FS = forced swim, FC = forced confinement, MA = methamphetamine. A–C: groups given FS on day-1, FC on day-2, and MA on day-3. D–F: groups given FC on day-1, FS on day-2, and MA on day-3. Arrows indicate when each stressor was administered after the time 0 blood sample. Fold change was calculated relative to average baseline determined at time −24 h and time 0, where time 0 = sample taken immediately prior to the stressor (FS or FC) and time −24 h was taken 24 h prior to time 0. Mean ± SEM (N) baseline CORT values for the FS-FC condition were FS group = 13.1 ± 0.9 (28) and FC group = 16.2 ± 1.6 (28) mg/dl. CORT values for the FC-FS condition were FS group = 13.6 ± 0.9 (24) and FC group = 12.9 ± 0.8 (24) ng/ml.

