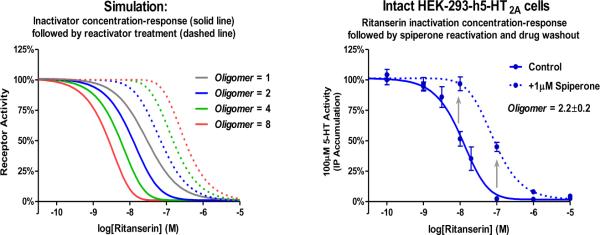
Figure 11. Simulation (A) and actual effect at h5-HT2A receptors (B) of ritanserin inactivation concentration-response and reactivation by a competitive antagonist.
A) At different levels of inactivation, different levels of maximal reactivation are predicted based on the reactivation model presented in Figure 9. Data are simulated for monomers, dimers, tetramers and octomers (Oligomer values equal 1, 2, 4, and 8, respectively). B) Reactivation results appear to be consistent with the simulated behavior of a dimer (i.e. Oligomer value is not significantly different from 2). The effect of the competitive antagonist spiperone (at a saturating concentration of 1μM) is the apparent rightward shift of the ritanserin inactivation concentration-response curve; the degree of this shift is limited by the number of interacting protomers. Arrows emphasize the partial reactivation of partially inactivated receptors. Data are mean±S.E.M. three independent experiments performed in triplicate.

