Figure 7.
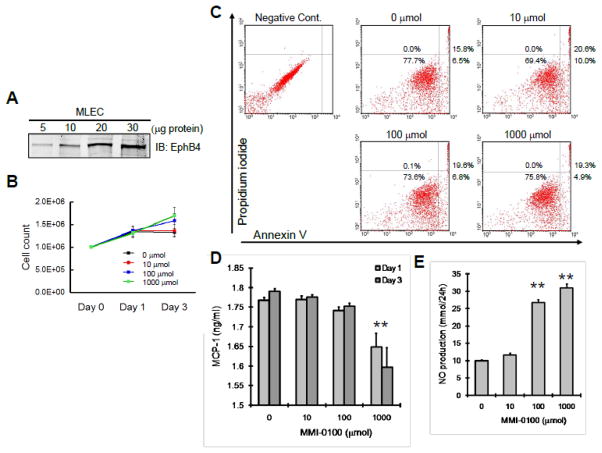
Effect of MMI-0100 on murine EC. A) Murine EC analyzed for Eph-B4, by Western blot. Representative of n=4 experiments. B) Graph shows mean of cell counts after treatment with MMI-0100. C) Representative analysis of MMI-0100 effects on EC apoptosis. N=3 experiments. D) Bar graph shows MCP-1 production by murine EC after MMI-0100 treatment. *, p<.0001. E) Bar graph shows NO production by murine EC after MMI-0100 treatment. **, p<.0001.

