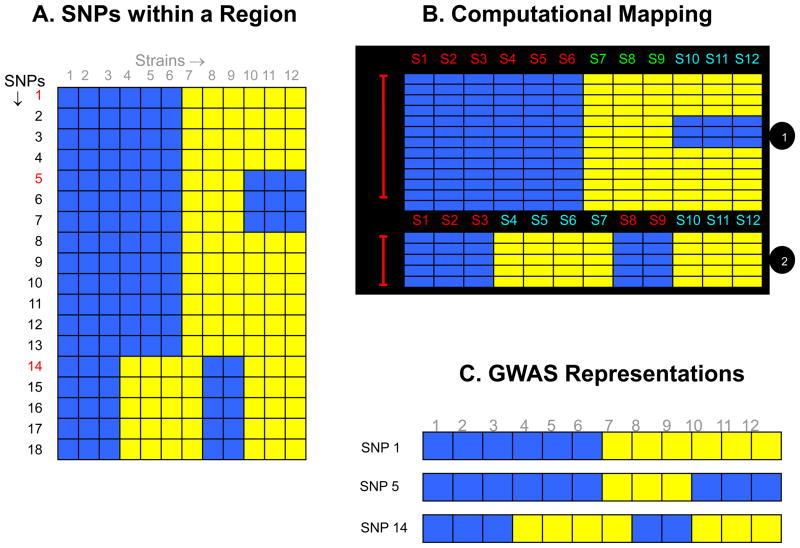
Figure 1.
(A) A diagrammatic representation of the pattern of genetic variation within a region of the mouse genome. Each of the 18 identified SNPs within this genomic region is represented as a row, and the blue and yellow colored boxes indicate different alleles for each of the 12 strains analyzed. (B) The computational method for haplotype block formation will organize these SNP alleles into two haplotype blocks that accurately represent the pattern of genetic variation within this region. The first haplotype block has three different strain groupings (haplotypes), while the 2nd block has two different haplotypes. Strains 1–6, strains 7–9 and strains 10–12 have distinct genetic patterns, which gives rise to the three different haplotypes in the first haplotype block. While in the 2nd block, strains 1–3 and 7–8 have one allelic pattern, and strains 4–7 and 10–12 have the other allelic pattern, which produce the two haplotypes in this block. (C) In contrast, if the genetic variation is represented by the alleles at a single SNP-without knowing the true pattern of genetic variation within this region the allelic pattern and strain groupings will vary, depending upon the marker SNP that is selected to represent this region.

