Figure 2.
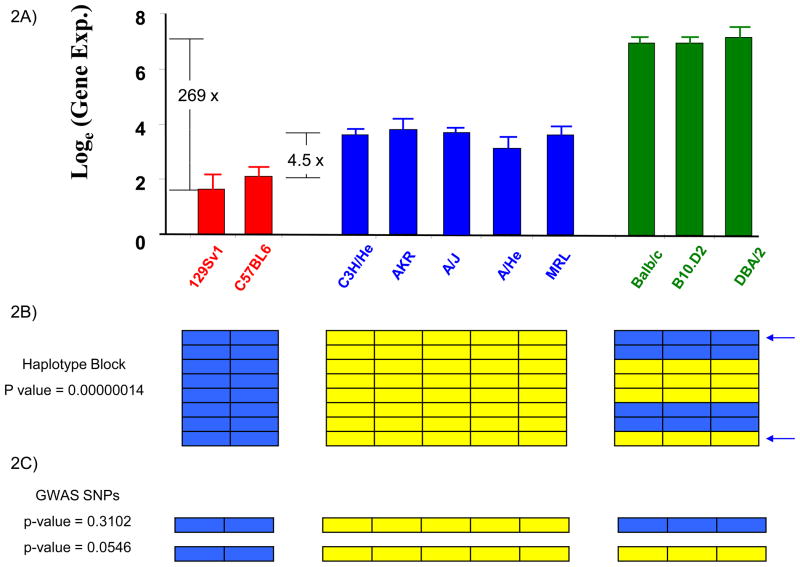
The difference in perspective when pulmonary H2-Eα mRNA expression is analyzed by linkage analysis in 2 strains, or in 10 inbred strains using HBCGM or GWAS methodology. (A) Graph showing pulmonary H2-Eα gene expression as the natural logarithm of the average of 3 independent measurements for each of 10 analyzed strains. The strains are divided into 3 distinct groups with high, intermediate or low levels of H2-Eα expression, which are indicated by different colored bars. The expression level of the DBA/2 strain (highest) is 269-fold greater than that of 129Sv (lowest), and is 37-fold greater than that of C3H/He (intermediate); while the two strains (C3H/He and C57BL6) analyzed by linkage analysis in [3] differ by only 4.5-fold (reproduced [7] with permission from Science). (B) HBCGM identified a haplotype block with 8 SNPs within the H2-Eα gene. Each SNP is represented as a row, and the colored boxes indicate the allele for each of the 10 analyzed strains. There were 3 different haplotypes within this region, and the one-way ANOVA model [7] showed a very strong correlation (p=1×10⁻⁷) between the haplotypic strain groupings and H2-Eα mRNA expression. (C) In contrast, a GWAS uses a two-sample t-test to assess the correlation between alleles at one SNP and the phenotypic data. The poor (p=0.054) or insignificant (p=0.31) correlation between individual selected SNP alleles (indicated by arrows) and the H2-Eα expression makes it impossible to detect the causal genetic locus if other spurious loci with smaller p-values were produced by the analysis, or after correction for multiple comparisons. This demonstrates the advantage that HBCGM has over GWAS methodology when multiple SNPs exert a composite effect on the phenotype.

