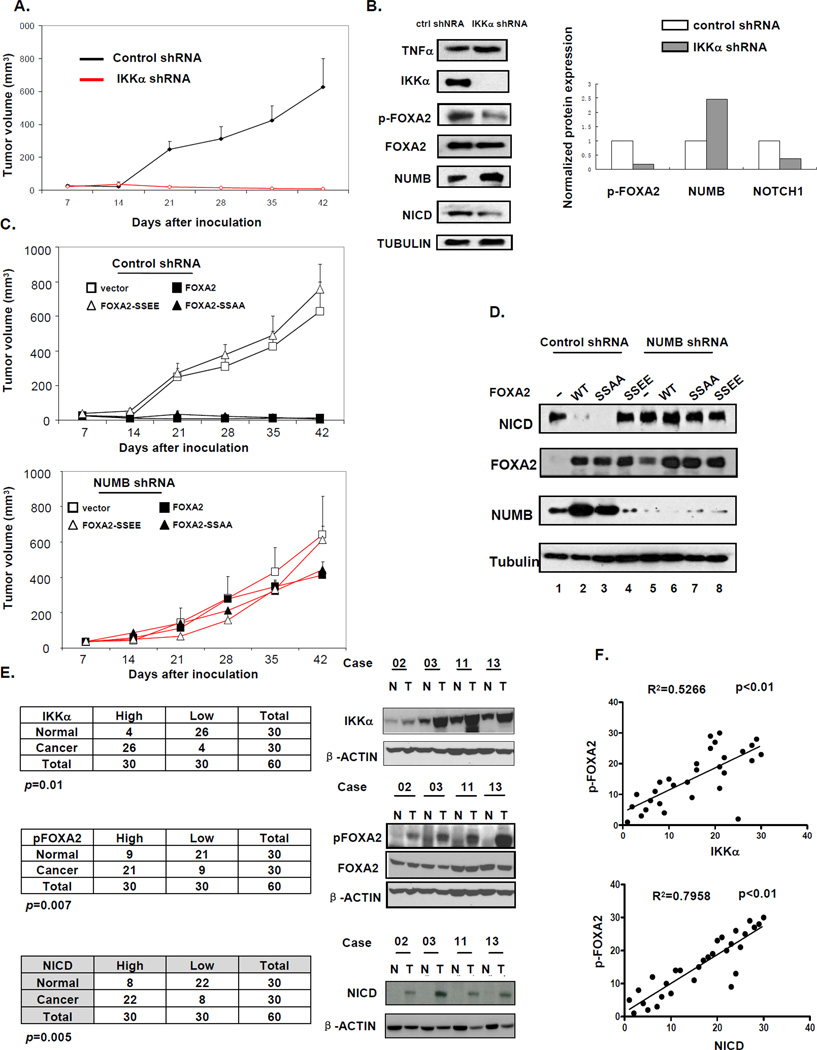
Figure 6. FOXA2 Blocks IKKα-Induced Cell Proliferation and Tumor Growth In Vivo.
(A) Hep3B cells were infected with retrovirus expressing control or IKKα shRNA. Mice were injected subcutaneously with 1 × 10⁶ cells. Error bars represent SD (n = 5). Please see the Experimental Procedures section for more detailed information.
(B) Tumor tissues from mice that received transplants were analyzed 10 days after transplantation and subjected to western blot analysis for indicated antibodies. Right: Expression levels of pFOXA2, NUMB, and NOTCH1 quantified with ImageJ software.
(C) Hep3B cells were infected with retrovirus expressing WT FOXA2, FOXA2-SSAA, or FOXA2-SSEE in the presence of (top) control shRNA or (bottom) NUMB shRNA. Error bars represent SD (n = 5). Please see the Experimental Procedures section for more detailed information.
(D) Tumor issues from (C) were harvested 10 days after transplantation and subjected to western blot analysis for NICD, FOXA2, and NUMB. α-Tubulin was included as control.
(E) Comparison of pFOXA2 (S107/111), IKKα, and NICD expression in tumors and their adjacent normal tissues. Protein expression was examined by immunoblotting 30 pairs (tumor and normal) of liver tissue samples and quantified with ImageJ software. Right: Four representative pairs (N, normal; T, tumor). Protein expression levels in tumor samples were normalized to those in paired normal tissues. Protein expression levels higher (or lower) than those in normal tissues were defined as “high” (or “low”).(P < 0.01, Pearson’s chi-square test.)
(F) Correlation analysis of pFOXA2 and IKKα/NICD expression levels in tumors (R2 > 0.5, Spearman’s rank correlation test).

