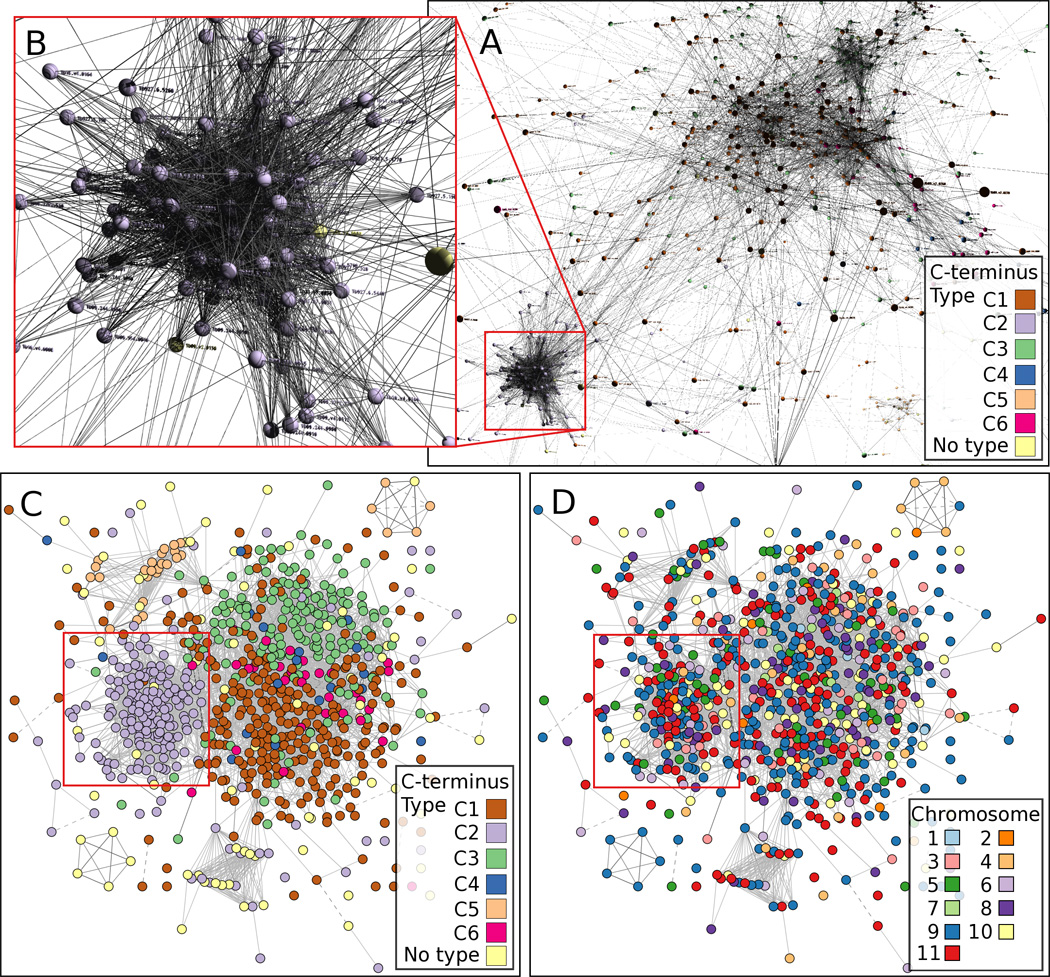
Fig. 4.

Clustering of C-terminal VSG sequences. Similar sequences among the C-terminal regions of 799 VSGs identified by BLAST between protein sequences with E-values less than 1e-10 are visualized as clusters in 3 dimensions (A,B) and 2 dimensions (C, D). The six reported VSG C-terminal domains (C1 – C6) are represented by nodes color-coded according to the C-terminal type (A, B, C), and lines between nodes represent BLAST hits. Clustering among C-terminal types is especially apparent in the case of type C2, which is outlined by red lines in panels A, C and D, and expanded in B. Similar clustering is not observed when C-termini are color-coded according to the chromosomes on which their genes are located (D). The color coding is difficult to see in panels A and B.
