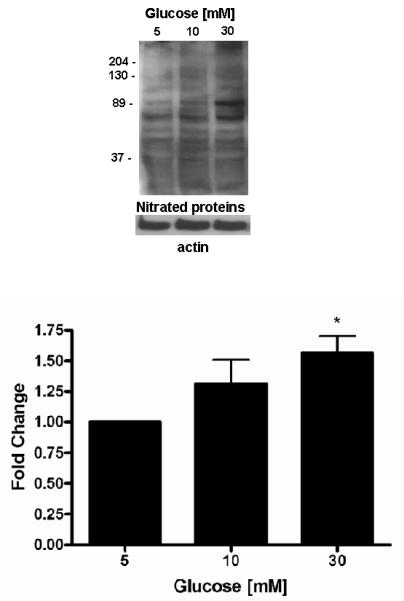
Figure 2.

Effect of high glucose on nitrated proteins
A representative Western blot of 3-NT is shown. Equal protein was loading confirmed by β-actin. Quantitation was performed by densitometry and data expressed as mean ± SEM of 5 separate experiments. * p<0.05 vs. 5 mM glucose † p<0.05 vs. respective glucose.
