
Figure 2. A Social Space Index to determine social interactions.
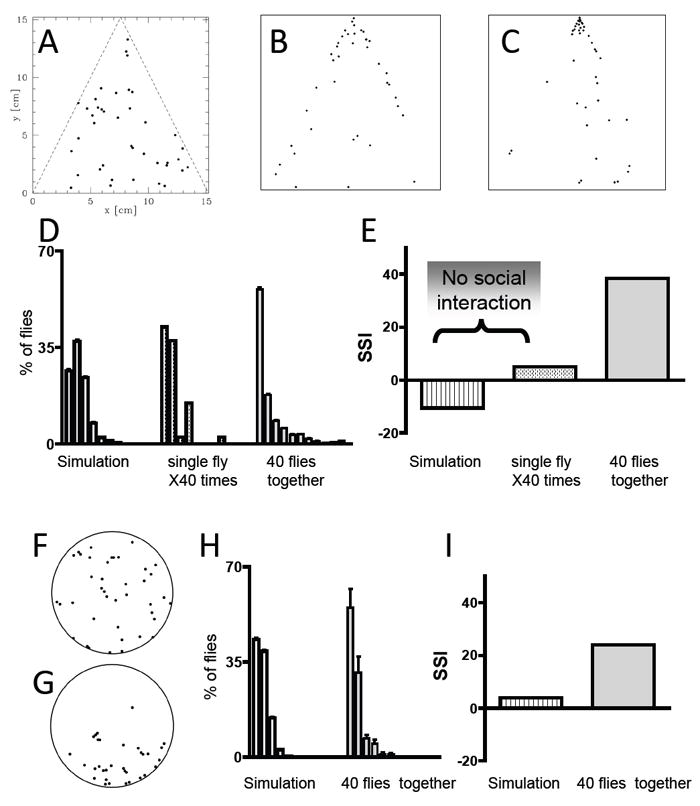
A-E) Vertical triangle chamber. A-C) Aggregation patterns of A) a random simulation of 40 dots; B) a merged image of 40 single flies; C) 40 flies assayed together. To increase visibility in the figure, the area of the marks representing each fly in (A) to (C), was increased (x 6) relative to their original size. Quantitation of social space was performed using the more precisely localized original mark. Comparison of A to B shows the effects of centrophobism and negative geotaxis; Comparison of B to C shows the added effects of interactions between individual flies. D) Quantification of social space between flies. The graphs represent the percentage of flies (±SEM) at the different distances from their closest neighbor, using bins of 0.5 cm. The 3 histograms differ significantly (Kolmogorov-Smirnov Test, P<00001). E) A simplified representation of the data is shown as a Social Space Index (SSI, defined as the value of the first bin minus the value of the second bin). An SSI score of =<0 suggests little or no social interaction (see text). F-I) Quantitation of behavior in a horizontal circular chamber. F) Aggregation patterns of a random simulation of 40 dots to compare to 40 flies G) (as in 2A-C the size of marks representing each fly was increased by a factor of 6 to enhance their visibility in the figure), H) Quantification of social space between flies in a circular chamber comparing the random simulation and the distribution of three trials of 40 flies tested together. The 2 histograms in (H) differ significantly (Kolmogorov-Smirnov Comparison indicates that the data-sets are different p<0.00001). I) Social Space Index comparing the simulation and 40 flies tested together in a horizontal chamber.