
Figure 4. Social space may depend on vision but not classical odor or cVA perception.
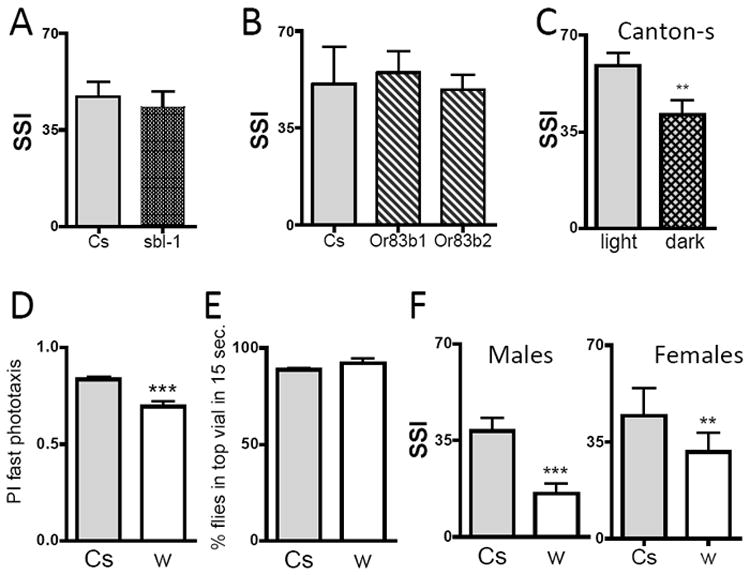
(A-C) Social Space Index is not modified in odor perception mutants; A) An allele of para (sbl1) compared to genetic background Canton-s, Males, n=6 trials of ~40 flies. B) Or83b1 and Or83b2 were outcrossed 6 times and compared to genetic background Canton-s, n=6 trials of ~40 flies (SSI±SEM). C) Flies show less social aggregation in darkness, under a red light. Graph represents the comparison of Social Space Index in light and dark conditions (Males, n=15 trials of ~40 flies, t-test indicates a significant difference of p<0.005, **). D-F) Outcrossed mutants white disrupting the eye pigments localization show less social aggregation, normal geotaxis and reduced phototaxis. w1118Cs10 were outcrossed 10 times, indicated as w, compared to their genetic control Canton-s (Cs). D) Reduction in performance in the fast phototaxis assay. Flies were given 5 times 15 sec. to go towards the light, in a counter-current apparatus (n=8 trials of ~40 male flies; SSI±SEM – t-test indicates that Cs is different from w p<0.0006, ***). E) No differences in negative geotaxis. In a climbing assay in the counter-current apparatus, the flies were giving 15 sec. to reach the upper vial (n=5 trials of ~40 male flies (SSI±SEM) – t-test indicates no differences). F) Decreased SSI in males and females white. In males, n=21 trials for Cs, and n=18 trials for w (SSI±SEM); t-test indicates that Cs and w are different from w (p<0.05, * and p<0.001, ***). In females, n=16 trials for Cs, and n=12 trials for w; t-test indicates that w is different from Cs (p<0.001, ***).