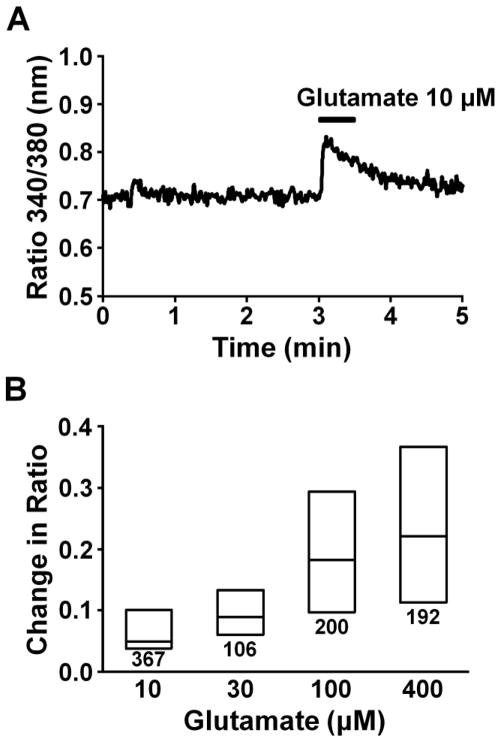
Fig. 3.
(A) A representative intracellular Ca2+ response in an astrocyte stimulated with glutamate, presented as change in Fura-2 fluorescence ratio. (B) Concentration response of glutamate (10–400 μM)-induced Fura-2 response. Each box represents the 25th, 50th, and 75th percentiles of Fura-2 fluorescence ratio response. Number under each box represents sample size.

