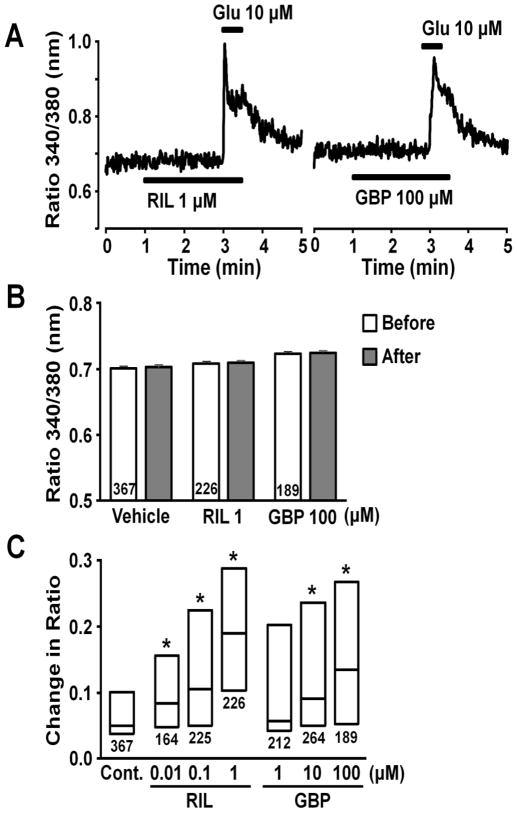
Fig. 4.
(A) Representative intracellular Ca2+ responses in astrocytes stimulated with glutamate (Glu) after perfused with gabapentin (GBP) or riluzole (RIL), presented as change in Fura-2 fluorescence ratio. (B) Effects of RIL and GBP on basal Fura-2 fluorescence ratio. Basal values were determined from the average ratio for 1 min before and after starting vehicle, RIL, or GBP perfusion. Number in each column represents sample size. (C) Effects of RIL (0.01–1 μM) and GBP (1–100 μM) on glutamate-induced intracellular Fura-2 response. Each box represents the 25th, 50th, and 75th percentiles of Fura-2 fluorescence ratio response. Number under each box represents sample size. *P<0.05 vs. control (10 μM glutamate alone).

