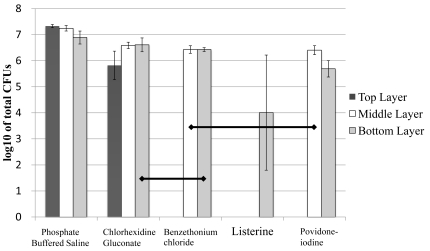
Fig. (4).
Graphic representation of bacterial colony numbers on Mitis Salivarius (MS) agar plates after treatment of biofilms with the solutions. Data are expressed as the mean log10 of colony-forming units per ml (CFU/ ml). Horizontal lines indicate statistically no significant differences after analyses using the non-parametric Kruskal-Wallis test followed by Mann-Whitne’s U test (P>0.05), n=9.

