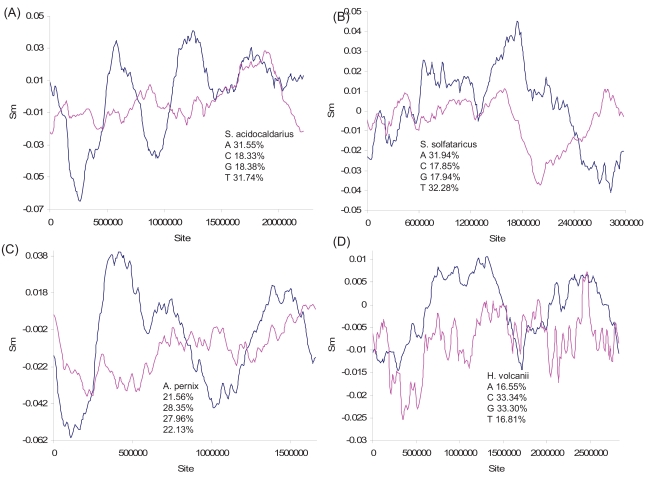
Fig. (7).
Nucleotide skew plots for genomes of (A) Sulfolobus acidocaldarius (NC_007181, window size = 317575, step size = 11129), (B) Sulfolobus solfataricus (NC_002754), window size = 413369, step size = 14961), (C) Aeropyrum pernix (NC_000854, window size = 238220, step size = 8348), and (D) Haloferax volcanii (NC_013967), window size = 405353 and step size = 14238. The species also contains three smaller replicons whose nucleotide skew plots are not shown).

