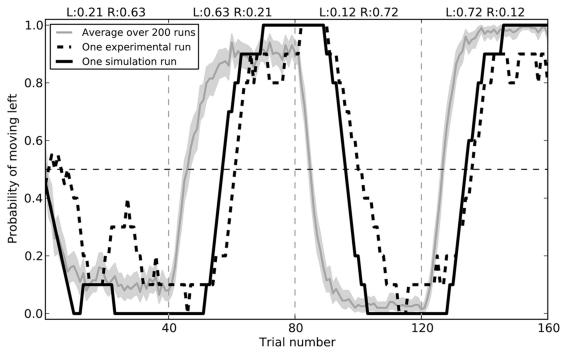
Figure 7.
Model performance compared to sample empirical data from Kim et al. (2009). Black lines show a single run, plotting the proportion of time the rat or the model chose to go left over 160 trials, averaged with a 10-trial window. The gray area gives the mean performance of the model over 200 runs, with 95% bootstrap confidence interval.

