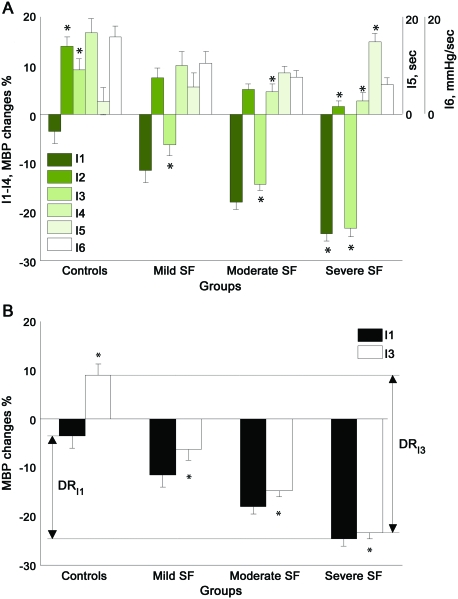
Figure 4. Performance of sympathetic indexes.
Comparison of sympathetic indexes I1–I6 (A). Comparison of dynamic ranges of indexes I3 and I1 (B). Dynamic range of I3 (DRI3) exceeds the dynamic range of I1 (DRI1). All values are expressed as mean ± standard error. MBP = mean blood pressure; SF = sympathetic failure.

