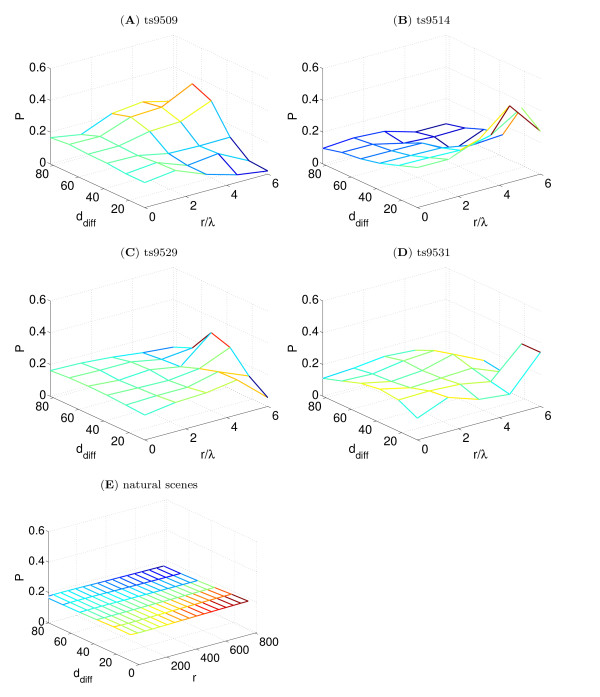
Figure 6.
Distribution of ddiff values for the four cases compared with natural scene statistics. (A-D) For each animal the probability distribution P (ddiff|r) was calculated by binning into bins of 20° in ddiff and 1.5λ in r. Because of the low number of connections the results have a significant amount of noise. (E) An analogous statistic was calculated for natural scenes. Although difficult to see at this scale (which matches that in panels A-D), there is small decline in probability with increasing ddiff so the mean value Ddiff(r) <45°. Because a large number of natural scenes could be counted and averaged there was very little noise in these results.

