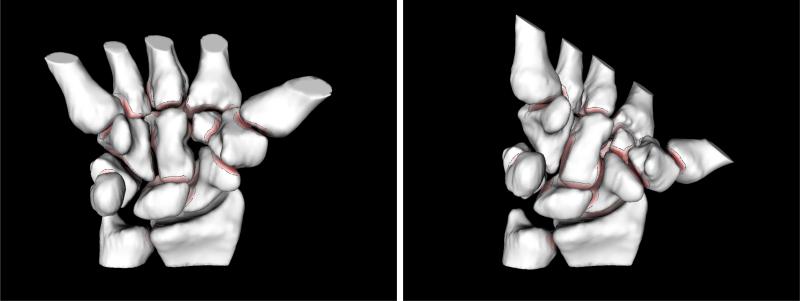
Fig. 1.
Modeling inter-bone joint-spacing with motion: two different poses recovered through CT-imaging, segmentation and registration of the same wrist joint (eight carpal, two forearm, and five metacarpal bones). Bones are color-mapped and contoured. The color saturation on bone surfaces indicates the distance to the nearest point on the opposite bone; darker regions are closer. Bone surfaces where the inter-bone distances are larger than a prescribed threshold (2mm) are shown in white. We trace these minimum-distance regions across multiple poses in order to estimate cartilage-map location and thickness.

