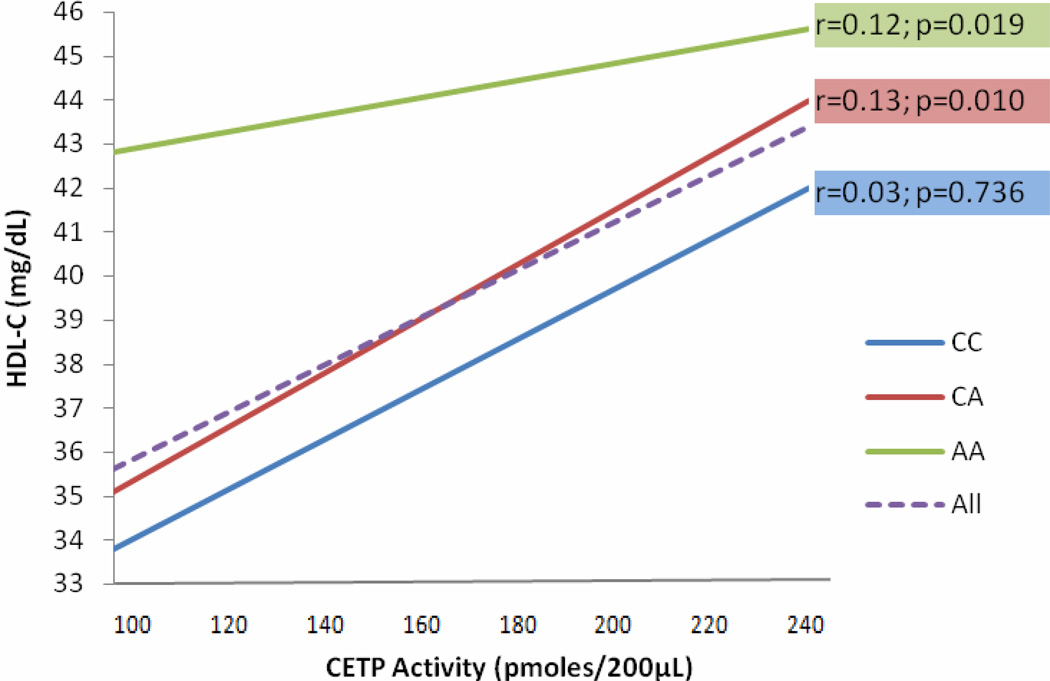
Figure 6. SNP (rs3764261) CETP Activity Interaction for Affecting HDL-C.
Figure 6 shows the relationships between CETP (rs3764261), HDL-C, and CETP activity. Dashed line (purple) slop shows correlation of HDL-C and CETP activity in combined rs3764261 (CC, CA, AA) genotypes (r= 0.12 p= 3.1×10⁻⁴). Three complete lines represent the correlation between HDL-C and CETP activity by each genotype. The uppermost green slop clearly shows that the increase in HDL-C levels in homozygous ‘AA’ carriers is independent of CETP activity.

