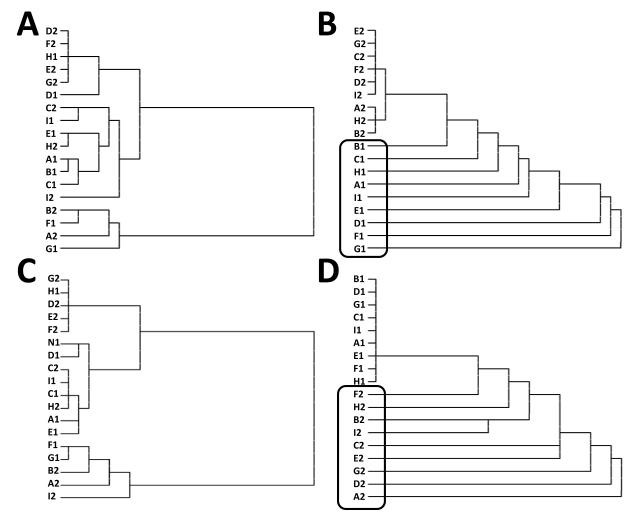
Figure 9.
Cluster plots reflect the Euclidean distance (indicated by the length of horizontal lines) between every item (indicated by letters along the y axis) and serial order (indicated by numbers along the y-axis); thus, if the path from one item to another requires a large amount of horizontal travel, then the representations of those items are relatively distinct. A. One prefrontal stripe shows an initially haphazard pattern of representational similarity across items, as indicated by the lack of systematic clustering between items and their order. B. After training, the same prefrontal stripe illustrated in A develops a highly structured representation, by collapsing across all items of serial order 2 (upper half of cluster plot) but differentiating among all items of serial order 1 (as indicated by the large horizontal lines separating each item; lower half, enclosed by rounded rectangle). This stripe is preferentially tuned to code items of serial order 1. C. A different PFC stripe also shows initially haphazard representational similarity. D. After training this stripe shows a different pattern than that illustrated in B, in that it collapses equally across all items of serial order 1 (upper half of cluster plot) but increasingly differentiates every item occurring with the other serial order (lower half, enclosed by rounded rectangle).

