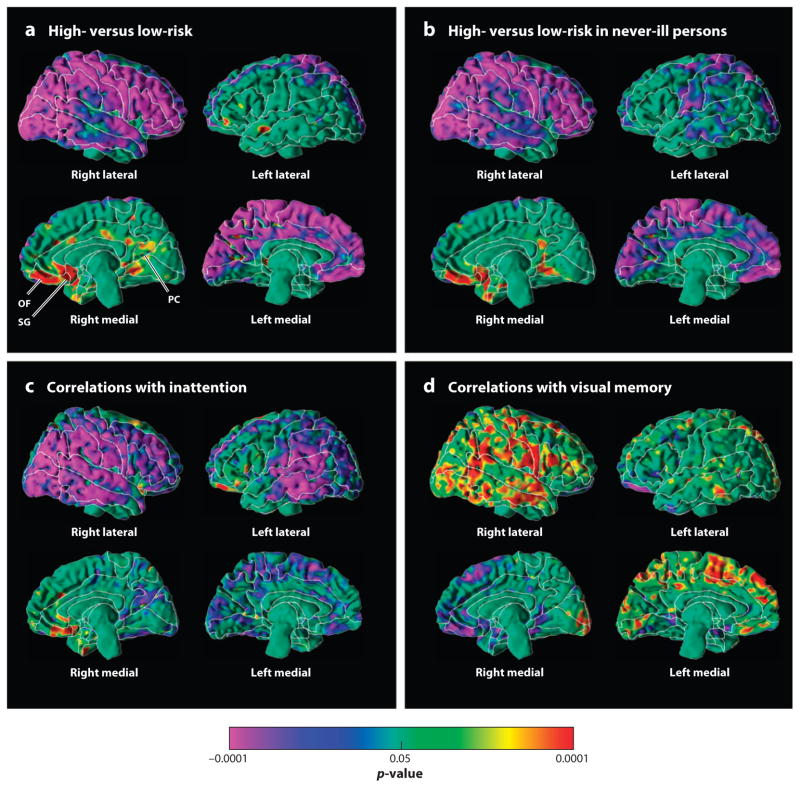
Figure 1.
Maps of cortical thickness. The statistical significance (probability values) of analyses of cortical thickness are color-coded at each point of the cerebral surface. The color bar indicates the color-coding of p-values for tests of statistical significance at each point of the brain. All statistical models covaried for age and sex. (a) Cortical thickness is compared at each point across all 131 members of the high- and low-risk groups. Warm colors (yellow, orange, and red) represent significantly thicker cortices and cooler colors (blue and purple) represent thinner cortices in the high-risk group. Significant thinning is present along the lateral aspect of the right hemisphere and the medial wall of the left. Significant thickening is present in the ventral anterior and posterior cingulate cortices, as well as the orbitofrontal cortex, along the medial wall of the right hemisphere. (b) Cortical thickness is compared across high- and low-risk groups but only in those participants (n = 79) who had no lifetime history of major depressive disorder (MDD). The pattern of cortical thinning is clearly present even in those who have never been ill. (c) These are maps of cortical thickness with measures of inattention, with cool and warm colors representing significant inverse and positive correlations, respectively. Inverse correlations are present along the entire extent of the lateral surface of the right hemisphere and the medial wall of the left, as well as the posterior portion of the lateral surface of the left hemisphere. In those regions, greater degrees of inattention accompany progressively thinner cortices. This same pattern of correlation was detected in the high-risk group alone, the low-risk group alone, and in both groups combined, indicating that this relationship of cortical thinning and its regional pattern is likely to exist in the general population regardless of the degree of familial risk present in any person. (d ) These are maps of cortical thickness with measures of performance on tasks on the Wechsler Memory Scales that require processing and recall of visual memory for social stimuli (mostly cartoon-type drawings that require recall of the identity of faces and social scenes). Cool and warm colors represent significant inverse and positive correlations, respectively. Poorer memory performance (lower scores) accompanies thinner cortices (i.e., correlations are positive) along the lateral surface of the right hemisphere and the medial wall of the right, in both the high- and low-risk groups separately and in both groups combined, indicating that this pattern of correlation obtains regardless of the degree of familial risk for MDD. The same spatial pattern of correlation as the pattern for our MDD endophenotype indicates that the cortical thinning in the high-risk group accounts for their poor visual recall for social stimuli. SG, subgenual cortex; OF, orbitofrontal cortex; PC, posterior cingulate.

