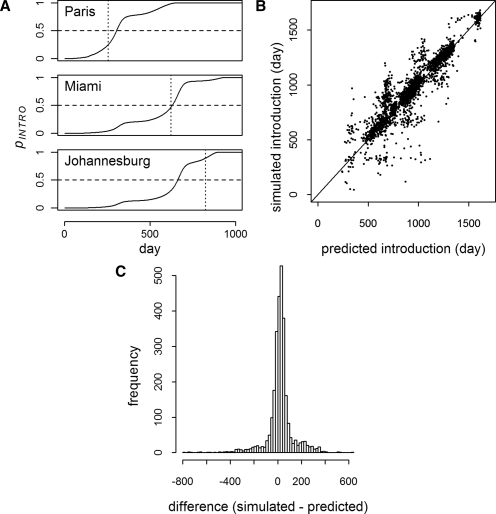
Figure 4.
Probability of introduction events (moderate R0). A shows the probability of introduction (solid line) for three cities as a function of time in a single simulation. For each city, the threshold, pINTRO = 0.5, is indicated by the horizontal dashed line, and the time of actual first introduction in the simulation is indicated by the vertical dotted line. B shows simulated versus predicted introduction times for all cities where introduction was predicted and occurred (N = 2,800). C is a histogram of the time difference between the predicted and simulated introductions in B (mean difference = 22 days, middle 95% = -253–277 days).

