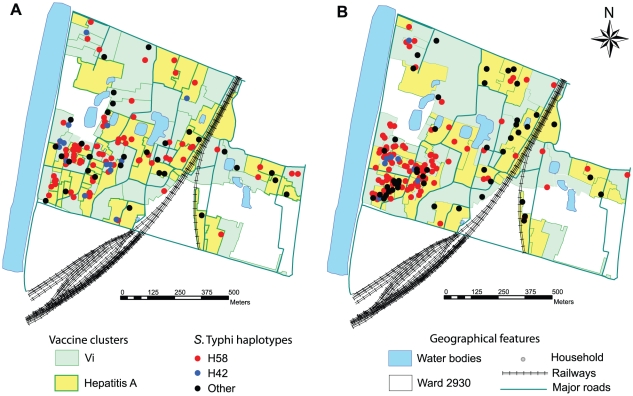
Figure 3. Spatial distribution of S. Typhi haplotypes.
Maps of the study site, illustrating the division of the site into 80 geographical clusters randomly assigned to receive Vi or control (hepatitis A) vaccine. The location of each typhoid fever patient's residence is indicated by a star, coloured by the haplogroup of the corresponding S. Typhi isolate. (A) S. Typhi isolated before administration of vaccine (May 2003–November 2004). (B) S. Typhi isolated after administration of vaccine (January 2005–December 2006).

