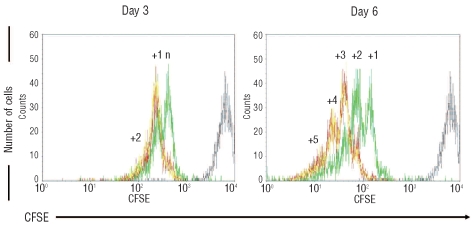
Figure 2.
CD34+ cell division kinetic profiles during co-cultures. Representative flow cytometry profiles of CFSE-labeled CD34+ cells co-cultured with MS-5/HOXB4 (red line), MS-5/HOXC4 (yellow line), or MS-5/GFP (green line). The position of the non-dividing cells corresponds to fluorescence intensity of the cells at Day-0 (gray line). N = number of cell divisions between day-0 and the first day-3 peak; the number above each peak represents additional numbers of divisions, according to the fluorescence intensity.

