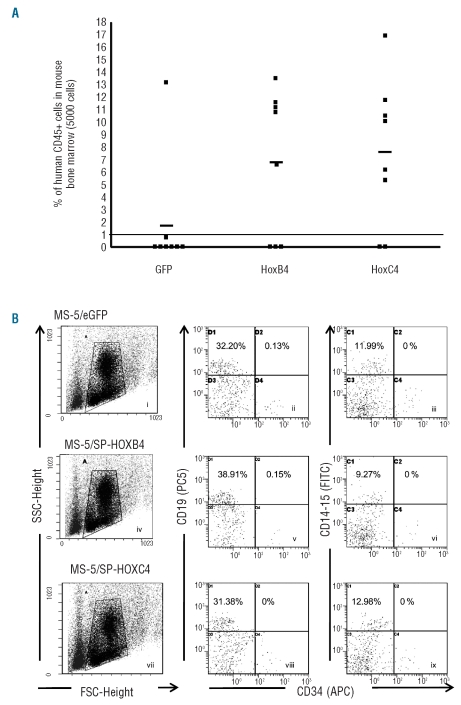
Figure 4.
Ex vivo expansion of SRC co-cultured with MS-5/HOXB4, MS-5/HOXC4, or MS-5/GFP control cells. (A) Proportion of human cells in the bone marrow of NOD-SCID mice transplanted with the total progeny from 5000 initial human CD34+ cells, co-cultured for 4 weeks with MS-5/HOXB4 (n = 8), MS-5/HOXC4 (n = 8), or MS-5/GFP (n = 8). Each symbol represents results from a single transplanted mouse. The three horizontal lines indicate the average percentages of chimerism among injected mice. (B) Representative flow cytometry profiles showing multilineage repopulation of engrafted human CD34+ cells after 4 weeks of co-cultures with MS-5/GFP (i–iii), MS-5/HOXB4 (iv–vi), or MS-5/HOXC4 (vii–ix) cells. Dot plots i, iv, and vii define gates for lymphoid and myeloid cells. The X axis indicates forward angle scatter (FSC), Y axis indicates side angle scatter (SSC). Dot plots ii, v, and viii are gated on CD19 lymphoid cells. Dot plots iii, vi, and ix are gated on CD14/CD15 myeloid cells. Percentages indicate positive cells for the defined antigens.

