Figure 1.
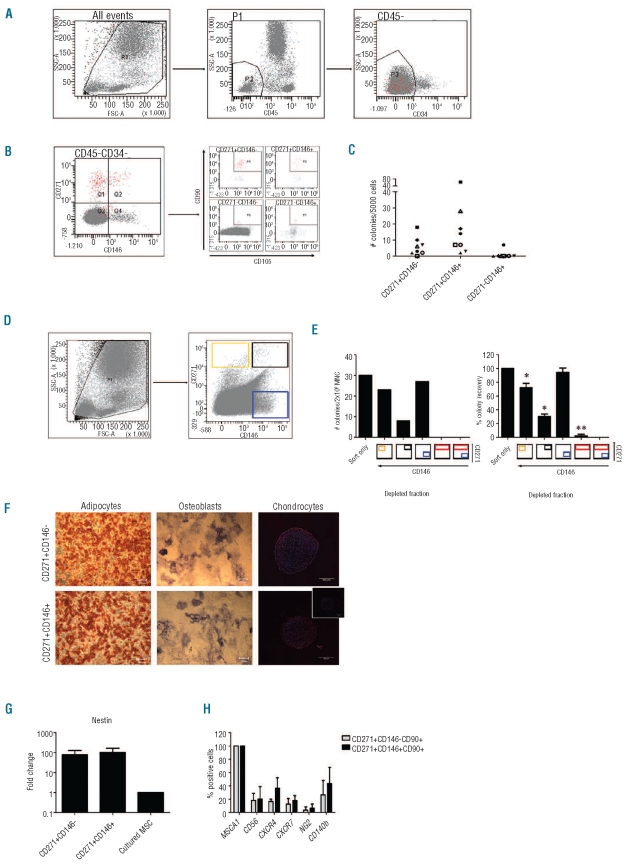
Characterization of MSC subsets in adult BM. (A and B) Representative figures showing the gating strategies to eliminate hematopoietic cells from BM mononuclear cells (MNC) (A), and selection of CD271 and/or CD146 positive cells from BM CD45−CD34− cells, including co-expression of CD90 and CD105 in each quadrant of the first panel (B). The CD271−CD146− cells predominantly contained nucleated erythrocytes, defined by co-staining for CD36 and CD235a (data not shown). (C) CFU-F content in 5000 CD271brightCD146−, CD271brightCD146+ and CD271−CD146+ sorted BM MNC (n=8). (D) Gating strategy for the depletion of CD271 and/or CD146 positive fractions from BM MNC by FACS without eliminating hematopoietic cells. (E) CFU-F content in 2x10⁶ depleted cells or cells that only passed through the sorter. Left panel shows one representative experiment, while the percentage of CFU-F is averaged in the right panel (mean ± SD, n=3). The colored boxes below the bars indicate which fraction is depleted. *P<0.05, **P<0.01. (F) Cultured CD271brightCD146− and CD271brightCD146+ MSC were differentiated towards adipocytes (left panel, scale bar 200 μm), osteoblasts (right panel, scale bar 200 μm) and chondrocytes (right panel: scale bar 500 μm; inset: isotype control; red: aggrecan; blue: dapi).
Images were taken on a Leica DC300 microscope, magnification 20X; chondrocyte images were made using a Zeiss LSM 510 META confocal microscope, magnification 10X. (G) Nestin mRNA expression detected by RQ-PCR in uncultured CD271brightCD146−, CD271brightCD146+ relative to cultured unfractionated MSC (mean ± SD, n=2). (H) Co-expression (% of all cells) of indicated markers on uncultured CD271brightCD146− or CD271brightCD146+ MSC detected by flow cytometry (mean ± SD, n=3).

