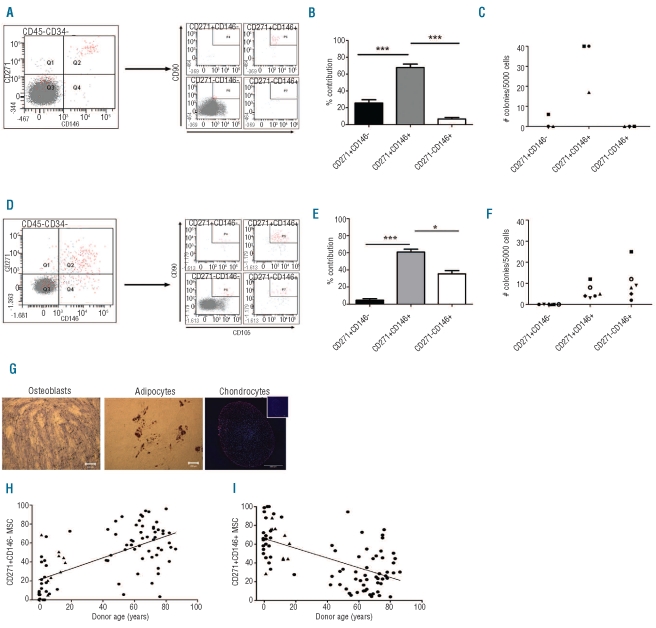
Figure 2.
MSC subsets are differentially distributed in pediatric and fetal BM. (A) Gating strategy to analyze CD271 and/or CD146 positive cells from pediatric BM CD45−CD34− cells. Each quadrant of the left panel was subsequently analyzed for co-expression of CD90 and CD105. Importantly, CD90 and CD105 co-expressing cells are now only observed in CD271brightCD146+ cells. (B) Distribution of CD271brightCD146−, CD271brightCD146+ and CD271−CD146+ cells in the CD45−CD34−CD105+CD90+ population of pediatric BM (mean ± SD, n=27). ***P<0.0001 (C) 5000 CD271brightCD146−, CD271brightCD146+ and CD271−CD146+ were sorted from BM MNC, and CFU-F content per fraction was evaluated (n=3).
(D) Gating strategy to analyze CD271 and/or CD146 positive cells in fetal BM CD45−CD34− cells. Each quadrant of the left panel was subsequently analyzed for co-expression of CD90 and CD105. CD90 and CD105 co-expressing cells are observed in CD271brightCD146+ and CD271−CD146+ cells. (E) Distribution of CD271brightCD146−, CD271brightCD146+ and CD271−CD146+ cells in fetal CD45−CD34−CD105+CD90+ BM (mean ± SD, n=6). *P<0.05 ***P<0.0001. (F) CFU-F content in 5000 CD271brightCD146−, CD271brightCD146+ or CD271−CD146+ sorted BM MNC (n=6). Fetal CD271−CD146+ cells now contain CFU-F, in contrast to adult and pediatric BM. (G) Cultured MSC obtained from CD271−CD146+ fetal BM cells were differentiated towards osteoblasts (right panel, scale bar 200 μm), adipocytes (left panel, scale bar 200 μm), and chondrocytes (right panel, scale bar 500 μm; inset: isotype control; red: aggrecan; blue: dapi). Images were taken on a Leica DC300 microscope, magnification 20X; chondrocyte images were made using a Zeiss LSM 510 META confocal microscope, magnification 10X. (H-I) The percentage of CD271brightCD146− (H) or CD271brightCD146+ (I) relative to the sum of all CD271+ and/or CD146+ cells that co-expressed CD105 and CD90 per donor was plotted versus donor age. Triangles represent patients with hematopoietic malignancy. The variation in distribution between donors was explained by donor age for 36% (P<0.0001) and 26% (P<0.0001) for CD271brightCD146− cells and CD271brightCD146+ cells, respectively.

