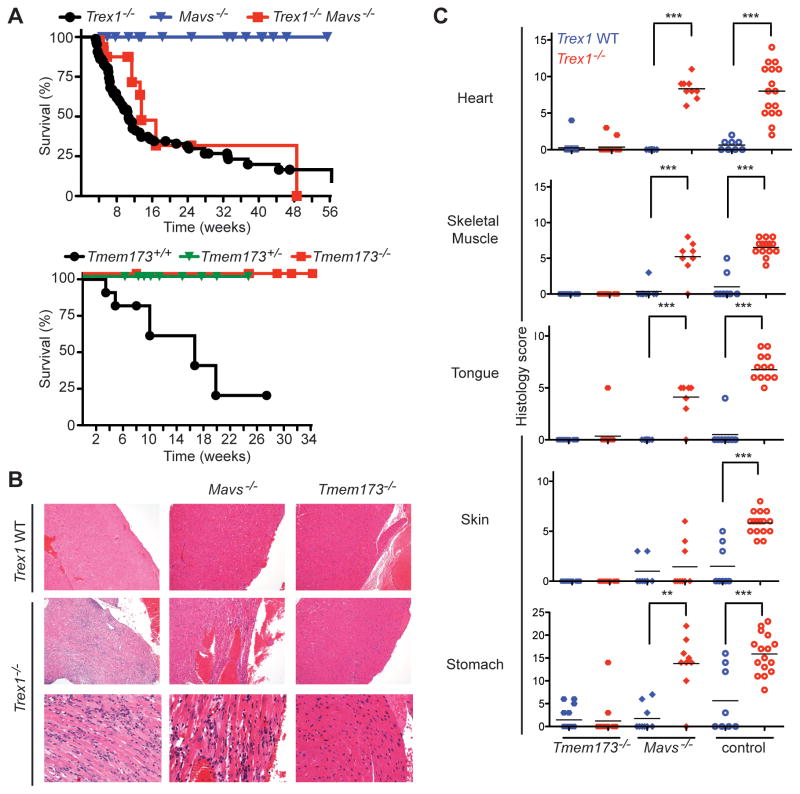
Figure 2. Trex1 is a specific negative regulator of STING-dependent signaling.
(A) Survival curves of Trex1−/− mice, Mavs−/− mice, and Trex1−/−Mavs−/− mice. The Mavs−/− mice were generated on a pure C57Bl/6 background, so the plain Trex1−/− controls include mice generated from other contemporary crosses within this background. The Tmem173−/− mice were on a mixed C57Bl/6:129 background, and plain Trex1−/− mice generated from intercrossing Trex1+/−Tmem173+/+ mice are shown as controls.
(B) Representative H&E-stained heart tissue sections from mice of the indicated genotypes. The original magnification in the top row is 10X and in the bottom two rows is 20X.
(C) Blinded analysis of the indicated tissues of Trex1−/− mice crossed to Tmem173−/− and Mavs−/− mice. Plain Trex1−/− mice and controls are the same as in figure 1B and are presented for direct comparison to the other genotypes. For these and all other histological analyses presented below, statistical analysis was performed using a two-tailed, one-way ANOVA with Tukey’s multiple comparison post-test. * = p < 0.05, ** p ≤ 0.005, *** = P ≤ 0.0005.

