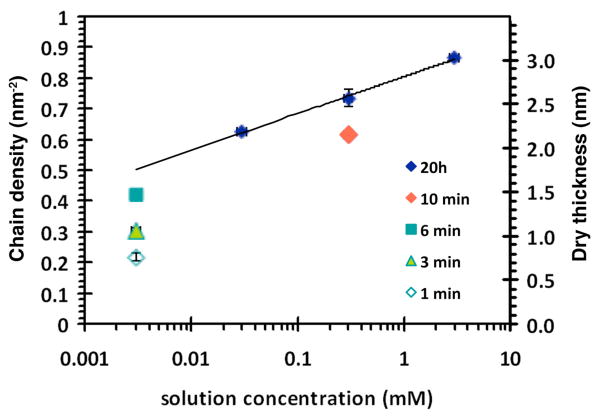
Figure 2.
Deposited PMP1-20 chain density (left axis) and dry layer thickness (right axis) as functions of coating solution concentration and deposition duration. All results correspond to depositions from cloud point buffers at 50°C and pH 6. The trend-line is a log fit to the 20 h deposition data. The error bars indicated ±1 SD.

