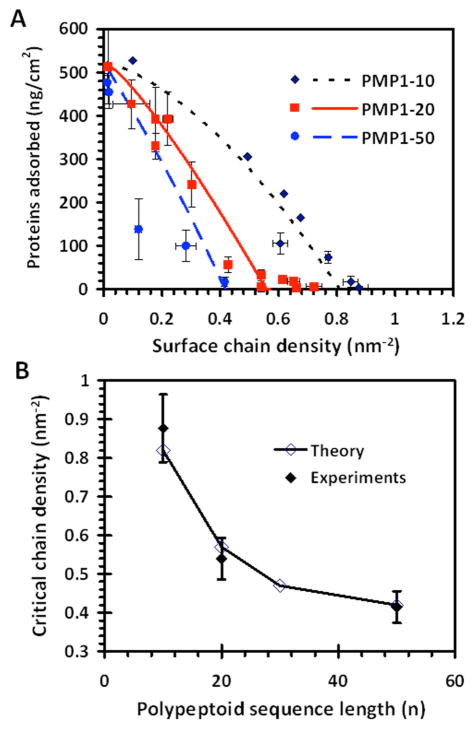
Figure 6.
A) Comparison between the adsorbed fibrinogen mass densities obtained experimentally by ellipsometry (symbols) and from molecular theory (line traces). The error bars indicated ±1 SD. B) Comparison between the theoretical and experimental critical chain densities identified from (A). The error bars indicate a ±10% uncertainty in the experimental results. The corresponding adsorption isotherm for PMP1-30 is shown in Figure S4.

